What is a Burn Up Chart in Scrum?
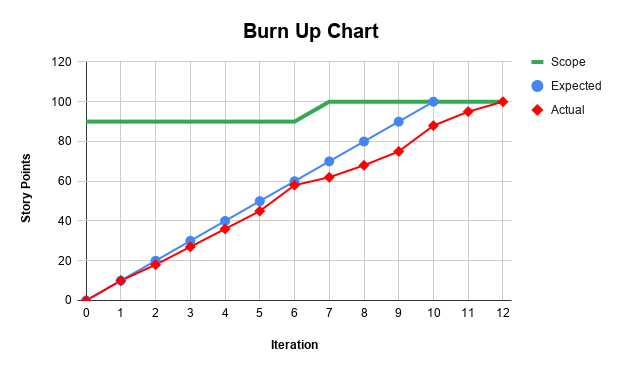
Burn-up charts are important visual tools that help Agile project teams manage their workload better. Surprisingly they are not as well understood or widely used as Burn-down charts. Through this article, I hope you can understand what a Burn-up chart is and the unique advantages it offers an agile project manager. What is a Burn-Up Chart? A burn-up chart is a visual tool used in agile and Scrum projects. It is a graphical depiction of the work completed compared to the project scope. A burn-up chart provides information in a simple and easy manner on how much work was actually done in the previous sprints, and what can be forecasted in the upcoming sprints. Burn-up charts are valuable for tracking progress and estimating completion dates for projects that span multiple sprints . What do the Three Lines in the Burn-Up Chart mean? Scope / Goal This is a horizontal line depicting the total effort needed to complete the feature Usually represented as Story Points...