Posts

Top 5 Agile Estimation Techniques

Image
Estimating the time, effort, and cost required for a project is one of the most important and challenging aspects of software development. Agile estimation techniques provide a way to address this challenge, enabling teams to plan and execute projects more effectively .. hopefully making the effort less tedious and more engaging for developers. Here are my Top 5 Agile Estimation Techniques - Dot Voting Planning Poker T-Shirt Sizes Bucket System Affinity Mapping Wide-band Delphi (Bonus) There are many other estimation techniques like Ordering Protocol, Uncertainty Scales, Sizing, etc. However, I have found the six techniques mentioned above more useful than others across multiple teams, in different geographies. Dot Voting Dot Voting is a technique that involves the team members voting on the most critical tasks or user stories. The process involves placing dots on the tasks or user stories that the team members believe are most important. This technique helps to identify the most cri

5 Tips to improve Burn Up Charts for Agile Projects

Image
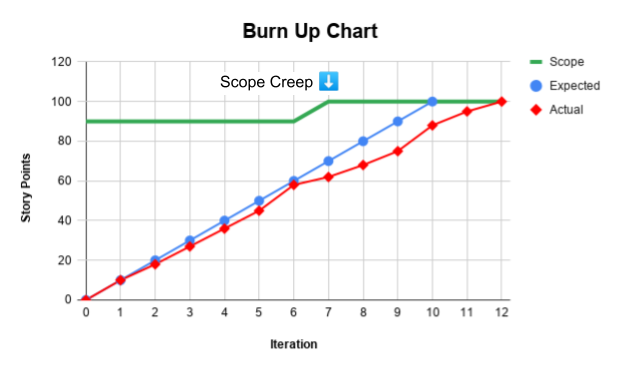
Burn Up Charts are one of my favorite agile project management tools. If you are familiar with basic burn-up charts and want to up your game, then add these 5 tips to improve your Burn Up Charts. 1. Outline your objectives Burn Up charts can offer a variety of flexible information options to an agile project manager. Instead of presenting a simple burn-up chart, it always makes sense to note down the key take-aways you want from your burn-up. Here are some of the Burn-up chart objectives that I often use - Identifying and managing scope creep Predicting story point velocity and agile delivery forecasts Resource Planning Planning release dates and governance activities Risk Management Burn-up charts can easily be used to layer one or more of these pieces of information. Follow along to see a few examples in action. 2. Identify Scope Creep in your Burn Up Chart Agile projects are not immune to scope creep. Especially in Banking and Financial Services and other mature or regulated industr

What is a Burn Up Chart in Scrum?

Image
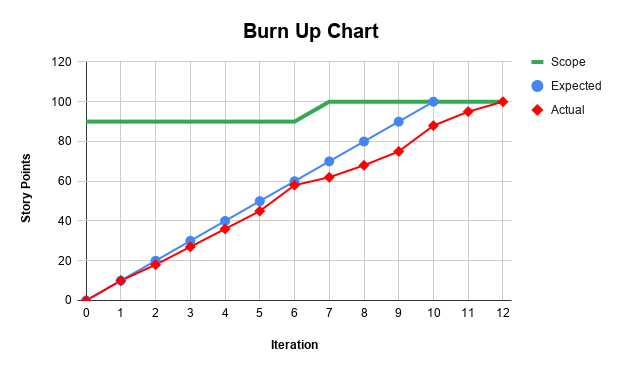
Burn-up charts are important visual tools that help Agile project teams manage their workload better. Surprisingly they are not as well understood or widely used as Burn-down charts. Through this article, I hope you can understand what a Burn-up chart is and the unique advantages it offers an agile project manager.  What is a Burn-Up Chart?  A burn-up chart is a visual tool used in agile and Scrum projects. It is a graphical depiction of the work completed compared to the project scope. A burn-up chart provides information in a simple and easy manner on how much work was actually done in the previous sprints, and what can be forecasted in the upcoming sprints. Burn-up charts are valuable for tracking progress and estimating completion dates for projects that span multiple sprints . What do the Three Lines in the Burn-Up Chart mean? Scope / Goal This is a  horizontal line depicting the total effort needed to complete the feature Usually represented as Story Points Any change in